Day at the Office: LINQ vs Stored Procedure

I love using LINQ (to EF to SQL).   It takes care the plumbing of getting data out of the database.  But there was one case where I had to swap it out for using a stored procedure.

The Setup

There were several screens that showed similar data, but constrained in different ways.  They all shared common code along these lines:

Base:

iQueryable Q  // defines the base query that all screens need

Overrides 1..N:

IQueryable Filter(IQueryable Q) { 
    return Q.Where(… additional clauses…); 
    // specific to the screen 
}

and then calling back to some Shared code:

IQueryable Filter(IQueryable Q, FilterSettings fs) {
  // apply standard filters that user could set at the app global level
}

The app used to then take this IQueryable and send it over to a ProjectAintoB() function that did the actual query (.ToList()) and then mapped that stuff out to a viewmodel / list item thing to shove into a grid:

return new GridItem { 
    Description = Q.Description, 
    ClientName = Q.Client.Name, 
    ManagerName = Q.Client.Manager.FullName, 
    Exceptions = Q.Exceptions, 
    NotesCount = Q.Notes.Count()
};

Note: this is simplified.  The original GridItem class had somewhere around 35 members, across 8-9 tables.

When we first started using the app, this worked well enough.   It returned quickly enough to not be noticeable.   However, as the app started to grow, things started to get noticeably slower, so we went onsite and did some profiling, and this is what we found:
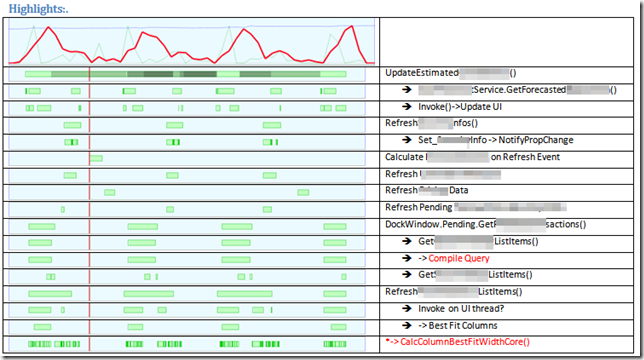
image
Actual screenshot/image from original analysis document around the problem

  • At the client site, it was a lot longer, with CPU pegged at 100% for 2-3 seconds.
  • Turns out, most of that CPU was LINQ attempting to build the query, not actually executing the query.
    • I didn’t notice this on my Dev machine because of superior hardware and multiple (8) processors. At the client, most of their processors were 2 cores, and the other core was busy doing client-ish stuff.
    • This was with EF 5.0 with .Net 4.0, before they had “cached compilation of queries” (.Net 4.5).  I tried upgrading to .Net 4.5; but still had problems.
  • After the query was executed, there was a network spike as the data returned from the server
    • Turns out, by having 9 tables returning, and the way EF work(ed|s), there was a LOT of repetition – the same Manager FullName across 5,000 rows, etc.
    • This lead to a large network payload of returned data
    • This was a killer over VPN.  (Which only affected me, the developer, but I am important!)

The Solution

We did it in two stages:

  • We kept the original concept of an IQueryable that gets modified by various layers to get down to the data that needs to be pulled back.
  • We executed it, but only pulled back a single item:   select g.GridItemId.   On some screens, this was 50 items; on other screens, 10000 items.
  • We called a stored procedure which took in a TVP (table valued parameter) of id’s, and returned multiple result sets:
    • one result set for the grid items + external id’s to other tables
    • one result set for all the Clients referenced by these grid items.
    • one result set for all the managers referenced by these grid items.
    • one result set for all the Notes referenced by these grid items.
  • We read these in, and directly constructed our grid item from these results.

And it worked wonderfully.

  • Average compilation time at the client site was down to 50 ms (most of the complexity was joining in to all the other tables to populate a grid item)
  • The second call to the sproc finished within 20-40ms or so
  • The payload across the wire was much smaller.

Here’s a screenshot of a paragraph I wrote in my excitement at getting it to run so much faster:

image

I also recorded a video of a before screen, and the after screen.  I can’t show that to you, but it was a hit.

The Result

This, and other performance enhancements over the last 6 months – according to the client last week:

Client: Yes!  Actually, 2.0 is faster than 1.0 now!  We dislike going back to 1.0.
Me:

Yess!

Day at the Office: Performance

I am working on a ticket where I have to augment data returned from an external system with some local overrides, without adversely affecting performance.  

Running the screen, it seemed a bit tardy to begin with.   So I pulled out one of the tools I love to use: a profiler.

I use the Ants Performance Profiler.  I paid for it with part of my Christmas bonus.  While I am a salaried employee, and my employer provides me with lots of stuff (awesome computer, pop, snacks, coffee, ReSharper, MSDN), there are additional things that I choose to use because I like who I am with them.  These include Ants, TeamViewer, nDepend, Beyond Compare, Fences, and VmWare, and a 3rd monitor.  Not all are paid for yet – two more christmas bonuses should cover it.

image

Well, that’s interesting.   Curiosity strikes:  What are those spikey areas about?  What’s going on?   How long is the initial query taking?  How long are the webservice calls taking?   If I add on to the end of the webservice call, how much would that grow?

Spike #1 – Query + Initial Screen Draw

Action: highlight the area and see where the time was spent.  If you’ve never seen this before, there’s some Windows GUI app running stuff to get out of the way:

image
image

  • The green highlights in the top image are times when the method under the cursor was fired. 
  • The stack trace is not so scary once you understand the internals of a running program a bit.
    • “A” is the part of the program which receives almost any kind of “this work needs to be done asynchronously” call.   This means Execute.OnUIThread(),  drawing events, bindings, etc – almost all get serviced here. 
    • “B” is where Task.Factory.Start() things get serviced.
    • “C” is any point where input needed to be handled, and ended up making the app do something.  Mouse movement, hover, clicks, etc – and part of whatever they ended up triggering.  That is what is highlighted in green
    • “D” we haven’t drilled into yet.
  • Unfortunately, if you Async a call from A to B, they show up in different parts of the performance stack traces (at least as of Ants version 7)

Drilling further into “D”:

image
image

  • Ah, I’ve seen this before.   “Measuring” usually means a grid has been set to “auto fit columns” mode – and as its drawing things, its figuring out how large they want to draw, how much to resize, and then redrawing.  

What about the actual query to get the data?   I found it way down in here (this time in bottom-up mode):

image
image

Wow, that was a lot of blurring.   Point being:  the query is fast, rendering the results in the grid is slow.

There’s another blog post that could be written here.  The stack trace above goes from “Get me stuff” to a IQueryable to a Project to … What, a Stored procedure?   Yep, it does, and it went from 25 seconds down to 2 seconds.  Sometimes, EF does not win.  

Spike #2: The Flat Plains of Update

imageimage

  • This is the result of getting “new information” from the external service, and trying to update the grid. 
  • What you are seeing is the NotifyOfPropertyUpdate() => saying “hey, UI, update yourself”  .. and waiting for the update to happen.   
  • -update- after a day of dinking around in this code, its simply a size issue.  There are 15000 rows of data in the grid – and we are updating every single one, with 4 columns of new data – and each each update “paints” itself on the screen.    This takes a while.   I couldn’t find any way to optimize this other than delaying the entire screen till we have all the data (ie, don’t paint twice).

Lets Try To Remove AutoFit: After Changes

before:

image

after removing AutoFit:

image

Not very different. 

image

Welcome to performance optimization.   Sometimes, you think you have found a smoking gun, but you haven’t.  I might have squeezed a 10% out of that, maybe.

I must now leave this blog post and really fix some things.   And get on with the original task, which was to add some local database overrides to an external web service call without making the system significantly slower.

-update- Its now the end of the day, and I have the additional lookup code written.  Here’s the impact:

image

  • The green highlight is the call to the external web service(s) (async) and the subsequent updating of the columns in the grid.
  • The pink/purple is the additional code that I wrote that patches up values from the local database.

Good enough.