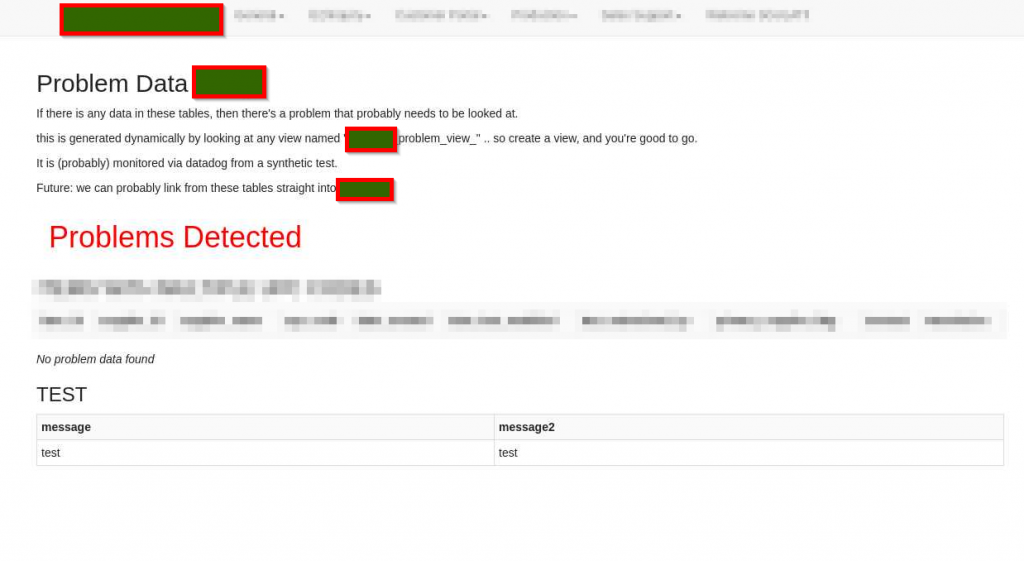
create view problem_view_darth_vader as (select ..... problem data)
In our case, it was that a particular item had two UPC codes from two suppliers. Add a couple of extra columns like department=’production’ and fix=’how to fix it’.
Next, write a generic thing which checks select view_name from information_schema.views where view_name like ‘problem_view_%’, and loops through those.. if anything has rows, displays the rows. I used a DataTable and DataAdapter.Fill() because then you get the columns even if there are no rows, unlike Dapper’s <dynamic>. Show this on a web page, along with a div id=SuccessDiv
Then, using your favorite “how’s my website doing” tool (mine is DataDog Synthetic Tests), do a test looking for success div. Set up an monitor, track failures. Datadog takes screenshots, so the errored data is saved with the failed monitor.
Result: Here’s the monitor zoomed in to when i introduced a test view to create a problem:
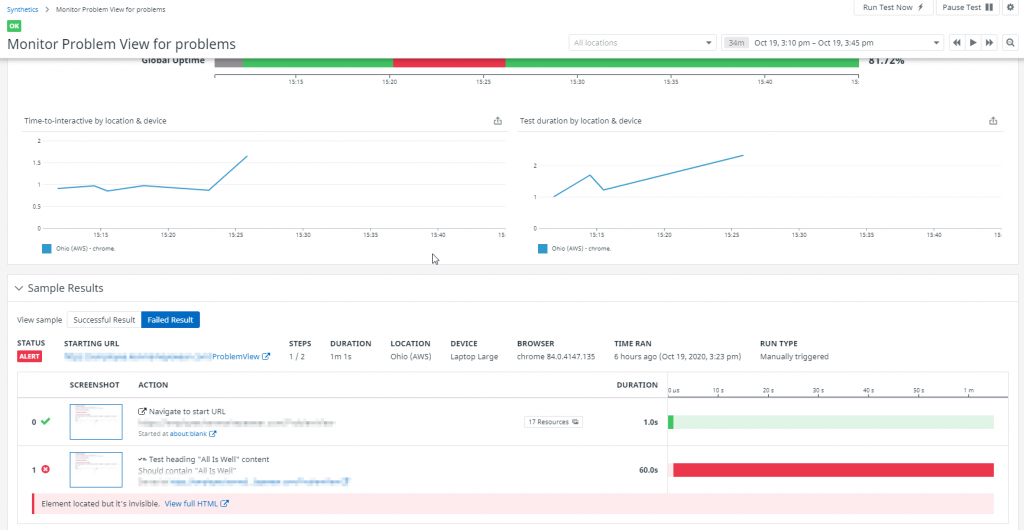
And here is the screen that was captured as part of the failed test:
The only side problem is that you don’t have control over how frequent the checks go. Probably different pages could be done and use different view names, like problem_view_darth_vader_60 to check every hour, for example. May improve it in the future.
I think the next things to put monitors up for are probably these particular things that get stuck without a thing. (Sorry, redacted, but you get the idea).