Latest Round of Harvesting Car-Tracks

image

In the past, I used Android – Torque, and an upload to Dropbox, to gather car-tracks.

I’ve started up that project again – this post focuses on my solution for gathering car-tracks for later processing.


imageAndroid-Tablet-Always-On

I got a Samsung Galaxy Note Tablet used, and I’ve stuck it in the glove compartment of my car.  Its plugged in to power, but power only runs when the car is turned on.  Click on image to zoom.

I use automate-it to run a few rules:

  • When power goes off, go into airplane mode.
  • When power comes on, turn off airplane mode, and start MyCarTracks

This seems to work as long as I drive a good amount each day. Then again, when I went to write this blog post, I found the tablet powered completely off – not enough charging?  temperamental battery?   Looks like not enough charging is the culprit.

It would be awesome to completely shut down the tablet when power is lost, and then power on when power is applied; however, I’d have to jailbreak to get that, and my 15 minutes at attempting to jailbreak, didn’t work, so, meh. 

MyCarTracks

imageI could totally get by with the free version of MyCarTracks.  Its an excellent product!  It has these features which I use:

  • Auto-record car tracks – after you reach 6 miles per hour
  • Auto-stop recording car tracks – when still for 5 minutes.

I can then get access to my tracks via an “Export All” feature, which will let me export to CSV, GPX, or KML.  GPX is the winner for me:

<?xml version=”1.0″ encoding=”ISO-8859-1″
standalone=”yes”?>
<?xml-stylesheet type=”text/xsl” href=”details.xsl”?>
<gpx
version=”1.0″
creator=”MyCarTracks”
xmlns:xsi=”
http://www.w3.org/2001/XMLSchema-instance”
xmlns=”http://www.topografix.com/GPX/1/0″
xmlns:topografix=”http://www.topografix.com/GPX/Private/TopoGrafix/0/1″ xsi:schemaLocation=”http://www.topografix.com/GPX/1/0 http://www.topografix.com/GPX/1/0/gpx.xsd http://www.topografix.com/GPX/Private/TopoGrafix/0/1 http://www.topografix.com/GPX/Private/TopoGrafix/0/1/topografix.xsd”>
<trk>
<name><![CDATA[2015-04-15 19:52]]></name>
<desc><![CDATA[]]></desc>
<number>29</number>
<topografix:color>c0c0c0</topografix:color>
<trkseg>
<trkpt lat=”38.242019″ lon=”-85.72378″>
<ele>132.89999389648438</ele>
<time>2015-04-15T23:52:25Z</time>
</trkpt>
<trkpt lat=”38.241821″ lon=”-85.723613″>
<ele>131.89999389648438</ele>
<time>2015-04-15T23:52:29Z</time>
</trkpt>
<trkpt lat=”38.241649″ lon=”-85.723491″>
<ele>129.1999969482422</ele>
<time>2015-04-15T23:52:32Z</time>
</trkpt>

MyCarTracks.Com

But Wait There’s More!

imageI went ahead and paid them $16 for a 1-year service for a small fleet, which gives me access to my tracks online (up to 2 years old) for quick viewing.   In order to make this happen, I sometimes hook up the tablet to my WIFI and say “synchronize all”.  There’s also an option where I can say “sync between 2 and 3 in the morning”, and I configure automate-it to take airplane mode off from 2-3, however, that’s hit or miss.

Once the tracks are loaded up to MyCarTracks.Com, I can browse them on a pretty nice map.  (picture at the top of the post).

What’s Next

My intention is to load these GPX’s into a small sql-server database, using Spatial (Points), and then come up with little data sets of “here’s all the tracks that passed through these two points”, etc.

I then want to take those tracks and convert them to a 3-D rendering with Z-axis = time, to compare various paths with each other.   

And I want to convert that into a 3-D sculpture.   Because, art.   My art.   Representation, archival – these I love.

But, one thing at a time.  I’m always welcome to shelf my projects; I only work on them when they are attracting my soul.  Might be a bit before I get there.  I do have a start on the gpx-parsing code, though: https://github.com/sunnywiz/cartracks2016

Amazing DIY Backup Camera Lines with Turn-Indicators v2.0

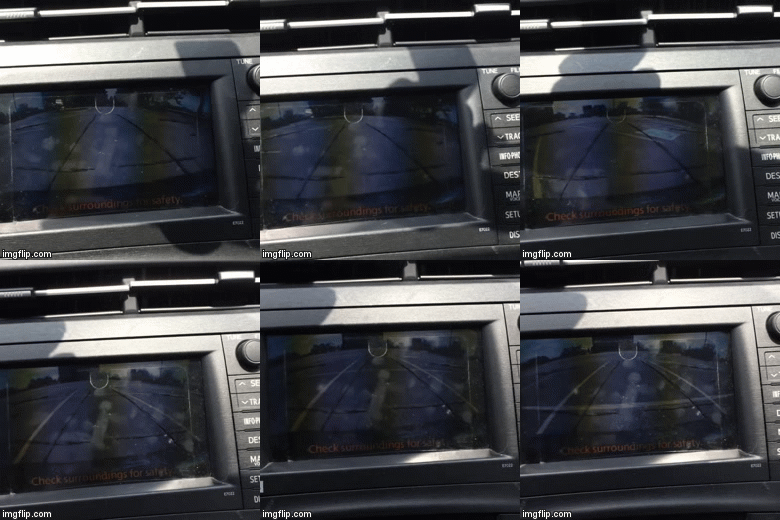
16aarnI’ve had two coworkers exclaim that this was an awesome idea, so I figure that makes it blog-worthy..   See if I can get an animated gif of this going ..  eh, not that good, but I’ll leave it.


How did I do it?

Step 0.1.  Acquire tablet screen protectors.  Beautiful Wifeling, who loves hunting for stuff, found them at a dollar store.

Step 0.7. Apply tablet screen protector to backup camera screen. This involved some scissor work.    Be amazed at how the polarization is just a little different, when seen through polarized glasses.

image

Step 1.   Find empty abandoned parking lot.  Where the parking lines all line up.  In my case, its at my work-building.

Step 1.1  Acquire dry erase markers and sharpie. 

Step 2.  Get the Backup Lines figured out. Line up the car with the wheels touching one line evenly, and then trace onto the screen protector with the dry erase marker.  Note that due to lens configuration its not a straight line, its slightly curved.  If you’re really good, you could probably lift a fingerprint from this image.

imageimage 

Step 3.  Get the hard turn lines figured out

image

  • Start out parked in a parking spot. 
  • Pull out, avoiding hitting the imaginary parked cars next to you, and turning the wheel as far as possible when possible, till you’re in the street and lined up.
  • Trace the outline of the parking spot with dry erase marker.
  • Test it out by trying to back into the spot.  You may have to adjust.
  • Once you’re sure, then go over it with a sharpie.

Step 4.  Profit

I have earned at least 27 self-credits at the good reverse parking jobs I’ve done.  Go me.  I’ll spend them on some ice cream.

Prius Speed vs MPG: Inconclusive

I had a roadtrip looming, so I figured I’d do some experimentation:

2014-07-23 19.49.57

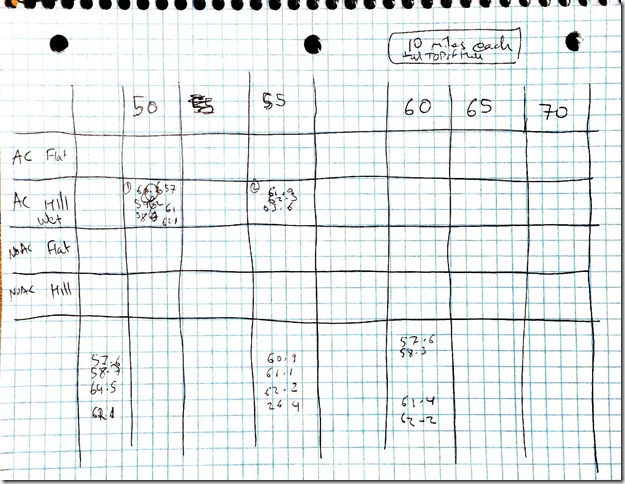
I wanted to find which highway speed would give me the best MPG.  I had some hilly areas (Louisville->Cinci) and some flat areas (Cinci->Columbus) to experiment with.      I figure after 10 miles, I’ll get an okay reading for average mpg, and I could move on, right?

Wrong.  

Turns out, the relative altitude of the car makes a HUGE difference.  If I reset my trip-meter at, say, 700 ft above sea level (as measured by my cellphone GPS), then at 600ft, I might have a MPG of 62, and at 800 ft it might be 57.  Even after 15 miles.  

I could have worked with this, except that every time I seemed to reset the trip meter, I never got back to that same altitude.  The road went down.  Or it went up.

Now given some fancy math I’m sure I could have calculated some numbers.  But not worth it. 

Thanks to some really slow traffic, though, I did figure out that in general, the Prius wants to get about 70MPG for anything over 45 mph, with the AC on, except that wind resistance knocks that number down to about 45MPG at about 70MPH.  

It seems that driving with the cruise set at 55 nets me in the low 60MPG’s. 

It does not appear there is a local maximum somewhere between 50 and 60.   50 is more efficient than 60.  And that is NOT a speed I’d set my cruise control to, sorry.  I don’t want to be one of THOSE Prius drivers.

Maybe some day when I’m bored I’ll drive a loop (I264, I71, I265, I64) at 50,55,60,65 MPH and record those numbers.   I can use the straight stretch near the ford motor plant as the transition from one speed to the other.

The Prius X-Dashboard

My car’s dashboard has.. mutated.   It grew .. stripes.    Precision stripes.

2014-04-07 17.19.56

What? Why? 

Well, it’s a 2010 Prius.  They added the “guide” marks to the rear backup camera starting in model year 2012.  I wanted guidelines.  So I lined the car up in our wonderful parking lot somewhat like this:

image

And I used some model stripe tape (Michael’s) to mark it on my rear view monitor:

image

Repeat on the other side, and now I have a much more precise backup camera.  And I didn’t draw on the display. 

BAMF!  (the sound, not the acronym)

Prius: So Far

image

I recently picked up a 2010 Toyota Prius III.  Here’s what I think about it.

Feature Review

Feature / Details Reaction I Wish…
45MPG in WINTER! BIG SMILE on my face.  No regrets.  Looking forward to better numbers in summer.
SKS (Smart Key System)
image
I don’t need to put a key in the ignition; just have it on me as I approach the car (Driver’s side only in my trim)
I LOVE this.  I’ve started trusting that the Key is In My Inside Pocket, and just go use the car.  The best part is not having to fumble to unlock the car as I walk to it. The better trim levels have this on all doors and the hatch; I’ve found myself wishing I had the upgraded trim – like when approaching the car with groceries.
Having an Electric Motor.

Note that any power to the electric motor was at some point power from gas; either recycled from the brakes, or directly charged from the gas engine.

Parking Lot Stalking with Cool Whizzing Noises, up to 35 mph (slow acceleration)

Dead silence when stopped.

LOVE IT!  It would be nice to have a larger electric motor; I believe the Plug-In-Hybrid does this.
Navigation System
image 
I’ve had better in a Garmin.  $150 to update unless I can find a year old DVD on eBay.

DVD-based NAV system; 2D only; some voice command stuff

NICE: exclusion zones. 

Regretting getting this option; however, having a NAV screen built in is nice.  I do like the use of the same screen for all the other functions (Bluetooth, Sirius, rear camera)
Backup Camera
image 
Using it every day!  Very good idea of where the back end of my car is.. little things like stopping before backing out of the driveway and pulling through parking spots. I might be adding a little marker to denote where “center” is on my screen.  Clear plastic overlay, of course.
Premium Speakers Maybe a little tinny (I had to turn treble down), but the Bass is nice and full. No regrets.  And the dial goes up past 11.  I’ve had it up to 42.
Sirius XM
image
Disappointment!  The signal fades in and out all the time; at first, the sound was worse than FM.   Also, the SCAN system can’t jump past gaps in blocks of channels. PriusChat (link) yields that the antenna is crap.  Can be replaced.   I might punt this feature entirely, just get a portable player with its own antenna.
XM Nav Traffic
image
It adds an overlay of traffic and provides road construction warnings.
Currently in a free trial mode.  Will continue to use and evaluate. It only covers the interstates around here, which I mostly stay off. Probably won’t keep this subscribed.
Bluetooth Integrated Phone
image
As long as I initiate Siri from the phone, I’m fine.  I avoid the Bluetooth phone controls on the car steering wheel; they only dial phone calls.  I hardly ever do phone calls.  

The in-car phone audio quality is wonderful.

I wish there was a dedicated Siri button.
The car acts as both a Phone-receiver and as a audio-player for the phone; there’s some confusion when it tries to control the phone and Siri gets involved.
Bluetooth Integrated Music
image
(This was streaming from Pandora)
I’ve used it with Pandora and some music playlists so far.  Have to be careful, as soon as I select the BT tab, it starts playing music on the phone – not sure  which app sometimes. (answer: the last app that was playing music) I sometimes miss text messages because there is no ding on the phone anymore (if I’m not listening to music on the phone).  i might need to turn auto-connect off and try that for a bit.
CD / Mp3
image
The 3-CD-Changer  loads behind the NAV screen; I haven’t played with this yet (and may not, as I have my iPhone) I’m thinking about putting together some DVD’s of my favorite MP3’s and leaving them in my car
Double Glove Compartments
image
Molly gets the top one, I get the bottom one.  No more jockeying for space.

Have to be careful when opening the bottom one, it just drops (and hits Molly’s knees)

LOVE IT! No regrets
Heads Up Display – Speed
image
I like it.   Although its not that much different from having it behind the wheel.    Digital readout takes a little getting used to.. can’t “feel” the needle move. I wish it were easier to turn some of the detail off – there’s a separate HUD button in later years (2012?)
Heads Up Display – HSIimage Very necessary for doing Pulse-and-Glide (link) and other Prius driving modes Mine has some screen burn in from this screen.  It interferes with the next screen:
Heads Up Display – Consumption
image
At first I did it with 1 minute intervals; then I relaxed down to looking at 5 minute intervals.   
Heads  Up Display – Trip History
image
Every time I fill up for gas, and I reset trip A, I’ll get a new bar!  I love it! I have this history available for both Trip A and Trip B.  My plan at the moment is Trip A = Gas Tank; Trip B = road trip.
Heads Up Display – Energy Monitor
image
Now that I have a feel for the car, I don’t use this display.  
EV, ECO, Power, and Normal modes
image
image
These only change pedal response;  Ie, how far do you have to push in to register a certain level of “driver demand”.   I use Eco Mode to fine-tune when doing fancy Prius things; If I want to feel peppy I switch back to Normal.  If you put pedal to the metal, you always get the same power.

Image source: priuschat 

Solar Package
image
Supposedly, runs the vent fan to keep the car cool during hot Arizona Days.

Its Winter.  I haven’t tried it. 

Louisville doesn’t have much direct sunlight.  Cool idea, but I’m not sure i did the right thing paying for a car which had this package. 
Sunroof I love opening the sunroof and windows during summer. no regrets
Dedicated USB Port I use this to charge my phone; leaving 2 12V slots still available for other stuff. no regrets
Non-circular Steering Wheel
image
I find I like it.  It gives me a larger steering wheel with good leg room, and when I’m turning it, it has a sturdy grip on the bottom.  The slight difference in feel is a good non-visual feedback of where I am in a turn. no regrets
Push-button Park
image
I love being able to go from Drive into Park without stopping in Reverse.  Use this all the time at the Sonic Drive Through line when getting my wife some Tea. no regrets
Two rear windows
image
I like it! in some situations, I can position my eyes so that the bar obscures bright headlights behind me. no regrets
Climate Control
image
It runs on electricity, not a belt – so the Gas Engine does not need to be on.  So, I could leave the car in Park for an extended time, with climate control, without wasting gas. no regrets

Note: Heat depends on the engine being warm.

Stuff I do not have on the car that I would consider in a future car

  • SKS on all doors – definitely.  I might even do the home-replacement-of-door-handles to make this happen.  Maybe.
  • Lumbar Support – this comes in at the Prius IV level and up.  Goes with Heated Seats most of the time.
  • Auto Cruise Control – If I drove the interstate for my commute, I would use the snot out of this.  It is basically a “slow down and follow” option while you’re cruising.  (I use cruise control all the time)
  • Parking Assist – I doubt I’d pay for this package, but I’d sure like to use it at least once.   It automatically steers your car into a tight spot.
  • Lane Keep Assist – It watches the road, and if it finds you drifting over, it moves you back to center.  This would be good for me, as apparently my steering drifts if I’m looking around / at something else (according to my wife).
  • Holy Shit Don’t Die Brakes – It watches the road, if a collision is unavoidable, it does the best it can to kick the brakes in and pre-tighten seatbelts.     There’s a warning: It might get confused if you pass somebody on a curve. 
  • Power Seat Adjustment – Its a simple thing.  Its no big deal.  But its nice.  And its also only in the advanced trim levels.

Summary

I like this car.   I had a slight case of buyer’s remorse on the options I didn’t get, but that’s fading pretty quickly. 

Planned Modifications

WeatherTech Floor Mats and Cargo Mats – at some point.

http://www.weathertech.com/product-education-center/floorliner-digitalfit/gallery/

image
Antlers – when I find them.  They are somewhere in the basement.

(not a picture of my car, but close)

I checked the basement.  Not found.  Maybe next year!

image
Upgraded NAV DVD if I can find one for under $50.  (Not having the Westport road exit is annoying) image
Separate Satellite Radio System (maybe) That maybe is growing smaller and smaller.  I think it might be replaced with a Pandora One subscription.

Selling and Buying a Car in Louisville

For the last week I’ve been doing a lot of Car Analyses.  Some of it was trying to figure out how to judge one car over another;  another was visiting my history of cars, and determining satisfaction, and pinpointing my motives.  This is what I’ve figured out;  I’ll start with the most useful first:

My Experiences with Places to Sell or Buy a Car in Louisville

CarMax Will usually buy at the bottom end of KBB trade in value, unless <= 50k, then gives a decent price Will sell at above KBB Value.  *

* = better quality cars than we’ve bought anywhere else.

Cottage Car Sales Cottage Car Sales Better buy value than CarMax Sells at below KBB Value usually (but small inventory and some quirks)
Sam Swope Honda World image Best value for the Honda that we sold them Haven’t bought one from them myself. 

Disclaimer:  commentary above is based on 1 statistical sample in some cases and may not be significant.

In the end, we got $2000 more for our 2008 Honda Accord Coupe from Sam Swope Honda World than we would have at either Cottage or CarMax.  Terry Smith there was very professional, courteous, and prompt; no pressure of any kind; I would definitely do business with him again.

Evaluating the Worth of a Car To Me

When I was in the throes of trying to make a decision between a X and a Y, I needed some way to evaluate the cars.  Here are the tools that I found:

UsedAutoGraph.com
image
Mileage vs Sales Price
Active Listings vs Active Auctions
Overall value decline
How long does the car last
Popularity
http://www.edmunds.com/honda/civic/2010/reliability.html
image
Its somewhat buried in the Edmunds website, and really i should give a link to identifix, however, look at that URL.  I could very quickly look up any make/model/year and find years to avoid.
http://autos.jdpower.com/research/Honda/Civic/2010/ratings.htm
image
Another awesome URL, gave a quick overview of the quality of the car. 
Car Max Inventory Pictures of cars.
Mileage.
Feature availability.

I also used a formula like this:

  • Consider a 2010 Honda Civic EX for $16k with 42k Miles on it.
  • According to UsedAutoGraph, it holds its value well (should not die) till 100k, probably even viable to 200k.   Knowing myself, I’ll find a reason to upgrade, so lets say 150k miles instead.   Approx end sale price then is $5K.
  • So I would get 108k miles for approx $11k, yielding around 10 cents a mile from the purchase price.
  • at MPG of 25/36, I would get about 30mpg out of it, at $3.50/gallon yields  3.50/30 = 11 cents per mile gas price.
  • So the car would be about 21 cents per mile, for me.

I did this same analysis for the cars we had owned till now.  I always thought that the Honda Pilot that we bought was a complete gas hog.. averaging 15 mpg..  however, the sale price vs the buy price made it BETTER than the Ford Focus that we also had.  I would not have thought that.   (Then again, the Focus had an encounter with a Deer which dropped its resale considerably)

Picking through CarMax Inventories

We pretty much knew we were going to buy the next car through CarMax, or at least use a CarMax car as the baseline to compare against.  My general approach was:

  • Use them for test drives to figure out which car we want (year differences, trim level differences, lie down in the trunk of the car, etc)
  • Assume that we will NOT be buying the car from the local (Louisville) CarMax
    • This freed me from the necessity to make the decision NOW.
  • Search their inventory for the right mileage, color, options nationwide.  We could also look at the CarFax history (for free) and see where the car used to live (avoiding Florida due to Salt damage).
  • Spend $99-$299 and arrange a transfer of the vehicle to Louisville.
    • At this point, the car is locked in as mine.   But it might take a day to three weeks to execute.
    • This gives me time to reflect and really decide if this is the car for me.
    • Good thing, because that Ford Escape that I ordered.. ended up having second thoughts and choosing not to buy it.
    • To CarMax’s benefit – I cancelled the order fast enough, they had not loaded it on the truck, so they gave my money back (they didn’t have to).  (Well, i was transferring a different car, so they moved it to the second transfer).
  • The car hasn’t arrived yet; I’m in that reflecting place.   So I can’t say what happens next; but it will probably involve test driving, and then buying this car.

Filtering CarMax Inventories

They have a LOT of cars, with a LOT of options.  Here’s how I tackled that, in an Excel Spreadsheet:

Initial search:  No filter, just the make/model/year range, sorted by price, and or mileage.  Pull the first 10 into the spreadsheet.  Get a baseline, the corners of the grid. This is the least / most amount of money I would spend on that car type.   Chart it.   Bubble chart using a function to show age by bubble size.

Successive Searches:  I narrow it down by features, getting more and more selective.  I pull each of those into the spreadsheet, but as a different series.   I layer the series so that the more specific ones drown out the less specific ones.

Result:

image

Using this approach, I could easily see that if I wanted X set of options, the lowest miles for the price was at Y, but if I added Z option to it, then that drove the price up by Y2.      Ie, how much car am I willing to spend on.  Note that I inverted circle sizes, so that newer cars were bigger circles. 

imageNote that while filtering in CarMax, I really like how they show numbers next to features.  This helps me figure out what are “standard” options and/or are packaged with each other.  In this screenshot example,  (106) is standard across everything, while the Satellite Radio Ready is a much more selective.    I got pretty good at it, being able to choose 3-4 options that narrowed down the car to exactly what I was looking for.

Summary

Its been a crazy week.   Its been a fun research process.   In the end, I have a car on order that I cannot wait to get my hands on.   I even made a picture of it my desktop background. 

I hope some of these tools are useful to you in your future.     Enjoy! 

Car Stats: Boogers! Foiled!

Minor setbacks in my Car Stats Gathering Solution.

Firstly, the repeated exposure to the really cold temperatures in the car, seems to have done something to my Droid battery.  It no longer charges when hooked up to the “normal” chargers; I had to hook it up to a 2.1A ipad-level USB port to get it to charge.  Rut-roh.  (Luckily my brother in law has given me his extra batteries from when he had a Droid, so I might have a spare.. but I may not be able to leave it in the car during the winter.  Data logging might be over for the time being).

Secondly, I found out I’m uploading the wrong folder. [Maybe].  

  • I was uploading /mnt/sdcard/.torque/tripLogs/<timestampfoldername>/<stuff>
  • The log that it generates is actually /mnt/sdcard/torqueLogs/*.csv

No problem.  I synced up the other folder instead, and…

None of my code works anymore!

The reasons are:

  • the torqueLogs csv files – very often have multiple headers (it writes to the same file twice in one driving?)
  • these log files are in the units that the app is set to, ie, miles per hour instead of km/h.   Thus, all my column names are off.

I’m going to have to do some refluctoring.  Or, decide that I like reading from Torque’s internal “triplog” (I found the separate option for turning this on/off) more than the “tracklog”. 

Also, I’m having trouble getting PeasyCam to work in Processing, it gives me some fun exceptions.   More on that later, when its more baked, but basically trying to do 3D renderings of Long,Lat,Time to determine the differences between the many routes I can take to work. There’s a lot of filtering and scaling work to do yet.

Car Stats–Speed vs Mileage Revisited

Previous posts in the series:

Revisiting the second post in this series, but this time:

  • All the data collected to date
  • Red for uphill, green for downhill, size of point for magnitude
  • Blue for mostly level

image

Analysis:

  • The ECU allows idling the engine when coasting, until I get to the last gear, at which time it changes its strategy – it always provides enough fuel to keep the engine purring at a somewhat higher number.  Probably because it doesn’t disengage the drivetrain.  But it does reduce the gas such that it’s a flat line across at 110 mpg or so.    (just enough oomph to prevent the engine from spinning down so fast that the car feels like its stuck in mud, probably.)
  • I get better gas mileage around 42 mph – closer to 40mpg.  Then it drops down to the 33mpg range as I get up to 55, but pretty much stays there through 75mph.
  • When accelerating, the engine opens up in such a way that I get a nice flat line at the bottom of the graph.

Code comments:

  • I added a column for altitude change – detected it within a file, I didn’t want to do it outside of the file boundary.
  • Sometimes, there’s a trailing comma in the column names.
  • I added better Axes to the graph.

Code:

$alldata = @(); 
$files = gci . -r -include "trackLog.csv"
foreach ($file in $files) { 
   $lines = get-content $file
   "Processing {0}: {1} lines" -f $file, $lines.count
   
   # to get around errors with header names not being valid object names
   $lines[0] = $lines[0] -ireplace '[^a-z,]','' 
   if (-not $lines[0].EndsWith(",")) { $lines[0] = $lines[0] + "," } 
   $lines[0] = $lines[0] + "AltChange"
   
   $data = ($lines | convertfrom-csv)
   
   for ($i=1; $i -lt $data.Count; $i++) { 
       $prevAlt = [double]$data[$i-1].AltitudeM
       $Alt = [double]$data[$i].AltitudeM
       if ($prevAlt -ne $null -and $Alt -ne $null) { 
           $data[$i].AltChange = $Alt - $prevAlt
       }
   }
   
   $alldata = $alldata + $data
}
"Total of {0} items" -f $alldata.count

$altmeasure = $alldata | measure-object AltChange -min -max -average

[void][Reflection.Assembly]::LoadWithPartialName("System.Windows.Forms.DataVisualization")
$chart = new-object System.Windows.Forms.DataVisualization.Charting.Chart
$chart.width = 800
$chart.Height = 600
$chart.Left = 40
$chart.top = 30
$chart.Name = "Foo"

$chartarea = new-object system.windows.forms.datavisualization.charting.chartarea
$chart.ChartAreas.Add($chartarea)

$legend = New-Object system.Windows.Forms.DataVisualization.Charting.Legend
$chart.Legends.Add($legend)

$series = $chart.Series.Add("Series1")
$series = $chart.Series["Series1"]
#FastPoint ignores color
$series.ChartType = [System.Windows.Forms.DataVisualization.Charting.SeriesChartType]::Point
$series.IsXValueIndexed = $false

$thresh = 0.05

foreach ($data in $alldata)
{
    if ($data.MilesPerGallonInstantMpg -eq $null) { continue } 
    if ($data.GpsSpeedkmh              -eq $null) { continue } 
    if ($data.AltChange                -eq $null) { continue } 

    $speed = [double]$data.GpsSpeedkmh * 0.621371          
    $mpg =   [double]$data.MilesPerGallonInstantMpg 
    $alt =   [double]$data.AltChange  
        
    if ($alt -lt -$thresh) { 
        # downhill green
        $color = [System.Drawing.Color]::FromARGB(100,0,255,0)
        $markersize = 1 - ($alt*2)
    } elseif ($alt -lt $thresh) { 
        $color = [System.Drawing.Color]::FromARGB(100,0,0,255)
        $markersize = 2
    } else  { 
        # uphill red
        $color = [System.Drawing.Color]::FromARGB(100,255,0,0)
        $markersize = 1+$alt*2
    }  
    
    if ($markersize -gt 5) { $markersize = 5 }
    
    $datapoint = New-Object System.Windows.Forms.DataVisualization.Charting.DataPoint($speed,$mpg)   
    $datapoint.Color = $color
    $datapoint.MarkerSize = $markersize
    
    $series.Points.Add($datapoint)
}

$chartarea.AxisX.Name = "Speed MPH"
$chartarea.AxisX.Interval = 5
$chartarea.AxisX.Minimum = 0
$chartarea.AxisX.IsStartedFromZero=$true

$chartarea.AxisY.Name = "MPG"
$chartarea.AxisY.Interval = 10
$chartArea.AxisY.Minimum = 0
$chartarea.AxisY.IsStartedFromZero=$true

$Form = New-Object Windows.Forms.Form 
$Form.Text = "PowerShell Chart" 
$Form.Width = 1100 
$Form.Height = 600 
$Form.controls.add($Chart) 
$Chart.Dock = "Fill" 
$Form.Add_Shown({$Form.Activate()}) 
$Form.ShowDialog()

Car Stats: Graphing with Powershell – Where Have I Been?

Previous posts in the series:

I could barely contain myself.  Thurday night, I had all kinds of data.. just calling my name.  

GPS Time, Device Time, Longitude, Latitude,GPS Speed(km/h), Horizontal Dilution of Precision, Altitude(m), Bearing, Gravity X(G), Gravity Y(G), Gravity Z(G),Miles Per Gallon(Instant)(mpg),GPS Altitude(m),Speed (GPS)(km/h),Run time since engine start(s),Speed (OBD)(km/h),Miles Per Gallon(Long Term Average)(mpg),Fuel flow rate/minute(cc/min),CO₂ in g/km (Average)(g/km),CO₂ in g/km (Instantaneous)(g/km)
Thu Jan 03 16:29:06 EST 2013,03-Jan-2013 16:29:11.133,-85.57728556666666,38.24568238333333,0.0,16.0,196.9,0.0,-0.015994536,0.9956599,0.0949334,0,196.9,0,17,0,31.66748047,19.45585442,259.47247314,-
Thu Jan 03 16:29:09 EST 2013,03-Jan-2013 16:29:14.004,-85.57729401666667,38.245684716666666,0.0,12.0,195.2,0.0,-0.015994536,0.9956599,0.0949334,0,195.2,0,20,0,31.66731453,45.80973816,259.47247314,-

Friday afternoon, once work things were completed, I started playing with it.  To start, I tried to read in the CSV file into Powershell.   I figured once I had it there, I could do *something* with it.

I faced some challenges:

  • The CSV column names are not “clean”, so I needed to sanitize them
  • Some files did not have certain pieces of data.
  • CSV import was a string, needed to be casted to a number before certain operations (“137” –gt 80.0 = false)
  • The units are fixed, part of the Torque app. (Actually, part of the OBDII standard)

After getting it read in, I looked around for a graphing library. Turns out I can use System.Windows.Forms.DataVisualization with Powershell. (thank you sir), which had some fun stuff:

  • FastPoint ignores colors
  • Had to turn off auto-scale on the Y-Axis
  • Made the charting controll Dock-Fill in the form

I ended up with this script:

$alldata = @(); 
$files = gci . -r -include "trackLog.csv"
foreach ($file in $files) { 
   $lines = get-content $file
   "Processing {0}: {1} lines" -f $file, $lines.count
   
   # to get around errors with header names not being valid object names
   $lines[0] = $lines[0] -ireplace '[^a-z,]','' 
   
   $data = ($lines | convertfrom-csv)
   $alldata = $alldata + $data
}
"Total of {0} items" -f $alldata.count

$speedmeasure = $alldata | measure-object GpsSpeedKmh -min -max
$speedspread = $speedmeasure.Maximum - $speedmeasure.Minimum
if ($speedspread -le 1.0) { $speedspread = 1.0 }

$mpgmeasure = $alldata | measure-object MilesPerGallonInstantmpg -min -max
$mpgspread = $mpgmeasure.Maximum - $mpgmeasure.Minimum
if ($mpgspread -le 1.0) { $mpgspread = 1.0 }

$ffmeasure = $alldata | where-object { $_.Fuelflowrateminuteccmin -ne "-" } | measure-object Fuelflowrateminuteccmin -min -max
$ffspread = $ffmeasure.Maximum - $ffmeasure.Minimum
if ($ffspread -le 1.0) { $ffspread = 1.0 }

[void][Reflection.Assembly]::LoadWithPartialName("System.Windows.Forms.DataVisualization")
$chart = new-object System.Windows.Forms.DataVisualization.Charting.Chart
$chart.width = 800
$chart.Height = 600
$chart.Left = 40
$chart.top = 30
$chart.Name = "Foo"

$chartarea = new-object system.windows.forms.datavisualization.charting.chartarea
$chart.ChartAreas.Add($chartarea)

$legend = New-Object system.Windows.Forms.DataVisualization.Charting.Legend
$chart.Legends.Add($legend)

$series = $chart.Series.Add("Series1")
$series = $chart.Series["Series1"]
#FastPoint ignores color
$series.ChartType = [System.Windows.Forms.DataVisualization.Charting.SeriesChartType]::Point
$series.IsXValueIndexed = $false

foreach ($data in $alldata)
{
    if ($data.MilesPerGallonInstantMpg -eq $null) { continue } 
    if ($data.Fuelflowrateminuteccmin -eq $null) { continue } 
    if ($data.Fuelflowrateminuteccmin -eq "-") { continue } 

    $speed = (([double]$data.GpsSpeedkmh              - $speedmeasure.Minimum) / $speedspread)  
    $mpg =   (([double]$data.MilesPerGallonInstantMpg -    $mpgspread.Minimum) /   $mpgspread)
    $ff    = (([double]$data.Fuelflowrateminuteccmin  -    $ffmeasure.Minimum) /    $ffspread)
    
    $higherspeed = $speed; 
    if ($higherspeed -gt 0.05) { $higherspeed = [Math]::Sqrt($speed) }
    $lowerspeed = $speed * $speed; 
    
    # MPG numbers seem to be clustered closer to 0 with a few annoying outlyers. spread them up a bit.
    #if ($mpg -gt 0.05) { $mpg = [Math]::Sqrt($mpg) }    

    # calculate color.   
    $blue = 250*$ff;
    
    # slower = more red
    # faster = more green
    # medium = yELLOW!
    $red = 250 - (250 * $lowerspeed)
    $green = 250 * $higherspeed
    
    $datapoint = New-Object System.Windows.Forms.DataVisualization.Charting.DataPoint($data.Longitude, $data.Latitude)   
    $color = [System.Drawing.Color]::FromARgb(125,$red, $green, $blue)
    
    $datapoint.Color = $color
    $series.Points.Add($datapoint)
    $datapoint.MarkerSize = ($mpg)*5 + 1
}

$chartarea.AxisY.IsStartedFromZero=$false

$Form = New-Object Windows.Forms.Form 
$Form.Text = "PowerShell Chart" 
$Form.Width = 1100 
$Form.Height = 600 
$Form.controls.add($Chart) 
$Chart.Dock = "Fill" 
$Form.Add_Shown({$Form.Activate()}) 
$Form.ShowDialog()

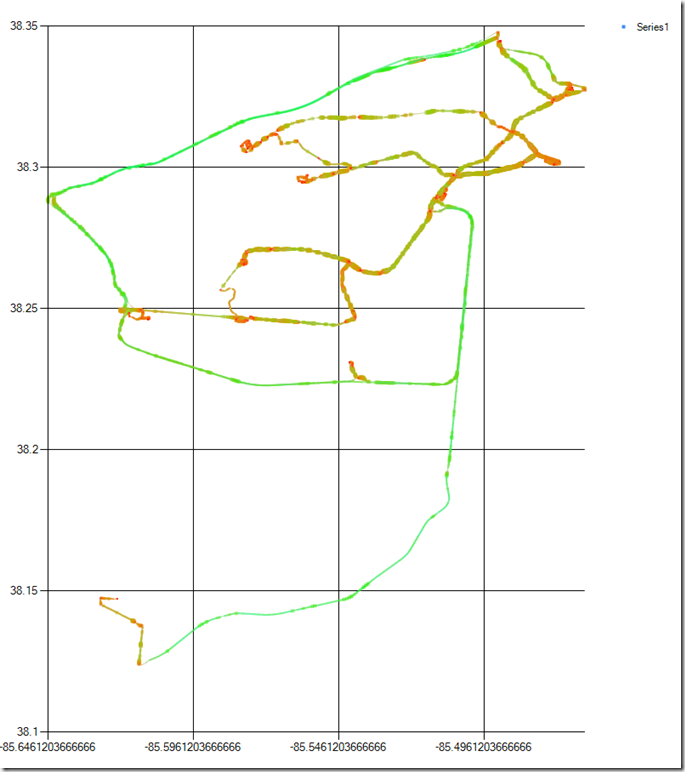
Which reads everything in, scrubs some data, figures some transforms, and yields me the following pretty picture:

image_thumb5

  • Green = faster, Red = slower.
  • Blue = Gas used (doesn’t show very well)
  • Fatter = Better MPG (I should reverse this, probably)
  • The green lines are the interstates (I71, I264, I64, and I265 shown)
  • Stop lights show up as little red dots.
  • I had to hand-scale the window till it looked right. Real co-ordinate systems some other day.

I would like to do this in 3-D, but I haven’t gotten my Processing chops quite figured out yet. Maybe next week!

Car Stats : Automatic Upload to Dropbox

Previous posts in the series:

After the scatterplot fun, I decided to turn on the option which logs whenever the adapter is connected to the ECU.  As a result, I started accumulating files on the DROID.   I need a way to get them to someplace where I could have more fun.

Here’s the solution I came up with:

  •  DropSync:  Is an app that will synchronize from the Droid up to Dropbox in the cloud
    • Configured for 1 way sync (push) only
    • Check every 12 hours.
    • I needed to install the Dropbox app for the authorization to succeed
  •  AutomateIt: Is an app that will check for events, and accordingly fire commands.
    • Rule 1:  When Connected to <my home wifi network> and Battery > 50%,
      • START DropSync
      • START <my favorite podcatcher> (experiment still in progress)
    • Rule 2: at 10pm turn Airplane mode on
      • I could probably make this “if battery < 50% turn airplane mode on”
    • Rule 3: at 6am if battery > 50% turn Airplane mode off
  •  Torque
    • No longer set up to invoke Airplane mode when power is lost.
    • Always log when connected to ECU
    • Log every 5 seconds

The result: When I pull into my driveway, and turn off the car..  it detects my home wireless network, starts dropsync, and uploads the files to the network.   Sometime later, it goes into airplane mode.   Sometime in the morning, it comes off airplane mode.   When I start the car the next morning, there’s usually plenty of battery left.

Things gave me a whole slew of files in Dropbox, each in a timestamped folder:

image image

GPS Time, Device Time, Longitude, Latitude,GPS Speed(km/h), Horizontal Dilution of Precision, Altitude(m), Bearing, Gravity X(G), Gravity Y(G), Gravity Z(G),Miles Per Gallon(Instant)(mpg),GPS Altitude(m),Speed (GPS)(km/h),Run time since engine start(s),Speed (OBD)(km/h),Miles Per Gallon(Long Term Average)(mpg),Fuel flow rate/minute(cc/min),CO₂ in g/km (Average)(g/km),CO₂ in g/km (Instantaneous)(g/km)
Thu Jan 03 16:29:06 EST 2013,03-Jan-2013 16:29:11.133,-85.57728556666666,38.24568238333333,0.0,16.0,196.9,0.0,-0.015994536,0.9956599,0.0949334,0,196.9,0,17,0,31.66748047,19.45585442,259.47247314,-
Thu Jan 03 16:29:09 EST 2013,03-Jan-2013 16:29:14.004,-85.57729401666667,38.245684716666666,0.0,12.0,195.2,0.0,-0.015994536,0.9956599,0.0949334,0,195.2,0,20,0,31.66731453,45.80973816,259.47247314,-

Next up:  Consuming the data!