I am working on a ticket where I have to augment data returned from an external system with some local overrides, without adversely affecting performance.
Running the screen, it seemed a bit tardy to begin with. So I pulled out one of the tools I love to use: a profiler.
I use the Ants Performance Profiler. I paid for it with part of my Christmas bonus. While I am a salaried employee, and my employer provides me with lots of stuff (awesome computer, pop, snacks, coffee, ReSharper, MSDN), there are additional things that I choose to use because I like who I am with them. These include Ants, TeamViewer, nDepend, Beyond Compare, Fences, and VmWare, and a 3rd monitor. Not all are paid for yet – two more christmas bonuses should cover it.
Well, that’s interesting. Curiosity strikes: What are those spikey areas about? What’s going on? How long is the initial query taking? How long are the webservice calls taking? If I add on to the end of the webservice call, how much would that grow?
Spike #1 – Query + Initial Screen Draw
Action: highlight the area and see where the time was spent. If you’ve never seen this before, there’s some Windows GUI app running stuff to get out of the way:
- The green highlights in the top image are times when the method under the cursor was fired.
- The stack trace is not so scary once you understand the internals of a running program a bit.
- “A” is the part of the program which receives almost any kind of “this work needs to be done asynchronously” call. This means Execute.OnUIThread(), drawing events, bindings, etc – almost all get serviced here.
- “B” is where Task.Factory.Start() things get serviced.
- “C” is any point where input needed to be handled, and ended up making the app do something. Mouse movement, hover, clicks, etc – and part of whatever they ended up triggering. That is what is highlighted in green
- “D” we haven’t drilled into yet.
- Unfortunately, if you Async a call from A to B, they show up in different parts of the performance stack traces (at least as of Ants version 7)
Drilling further into “D”:
- Ah, I’ve seen this before. “Measuring” usually means a grid has been set to “auto fit columns” mode – and as its drawing things, its figuring out how large they want to draw, how much to resize, and then redrawing.
What about the actual query to get the data? I found it way down in here (this time in bottom-up mode):
Wow, that was a lot of blurring. Point being: the query is fast, rendering the results in the grid is slow.
There’s another blog post that could be written here. The stack trace above goes from “Get me stuff” to a IQueryable to a Project to … What, a Stored procedure? Yep, it does, and it went from 25 seconds down to 2 seconds. Sometimes, EF does not win.
Spike #2: The Flat Plains of Update
- This is the result of getting “new information” from the external service, and trying to update the grid.
- What you are seeing is the NotifyOfPropertyUpdate() => saying “hey, UI, update yourself” .. and waiting for the update to happen.
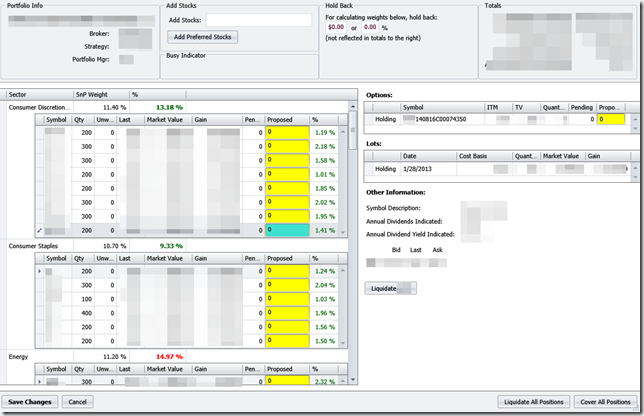
- -update- after a day of dinking around in this code, its simply a size issue. There are 15000 rows of data in the grid – and we are updating every single one, with 4 columns of new data – and each each update “paints” itself on the screen. This takes a while. I couldn’t find any way to optimize this other than delaying the entire screen till we have all the data (ie, don’t paint twice).
Lets Try To Remove AutoFit: After Changes
before:
after removing AutoFit:
Not very different.
Welcome to performance optimization. Sometimes, you think you have found a smoking gun, but you haven’t. I might have squeezed a 10% out of that, maybe.
I must now leave this blog post and really fix some things. And get on with the original task, which was to add some local database overrides to an external web service call without making the system significantly slower.
-update- Its now the end of the day, and I have the additional lookup code written. Here’s the impact:
- The green highlight is the call to the external web service(s) (async) and the subsequent updating of the columns in the grid.
- The pink/purple is the additional code that I wrote that patches up values from the local database.
Good enough.













![Samsung_ATIV_Smart_PC_Pro_700T_35511640_06_610x436[1] Samsung_ATIV_Smart_PC_Pro_700T_35511640_06_610x436[1]](http://geekygulati.files.wordpress.com/2013/11/samsung_ativ_smart_pc_pro_700t_35511640_06_610x4361_thumb.jpg)

